
School Mapping
Schools sit still, but everything around them moves. Families move house. New estates appear. Bus routes change and a boundary that looked neat last year starts to feel a bit wrong this year.
School mapping is basically trying to see that movement, before it becomes a problem. Because planning on instinct can work for a while, then it stops.
And once you’ve made a decision, like a new site, a new route, a new outreach plan, it’s hard to undo.

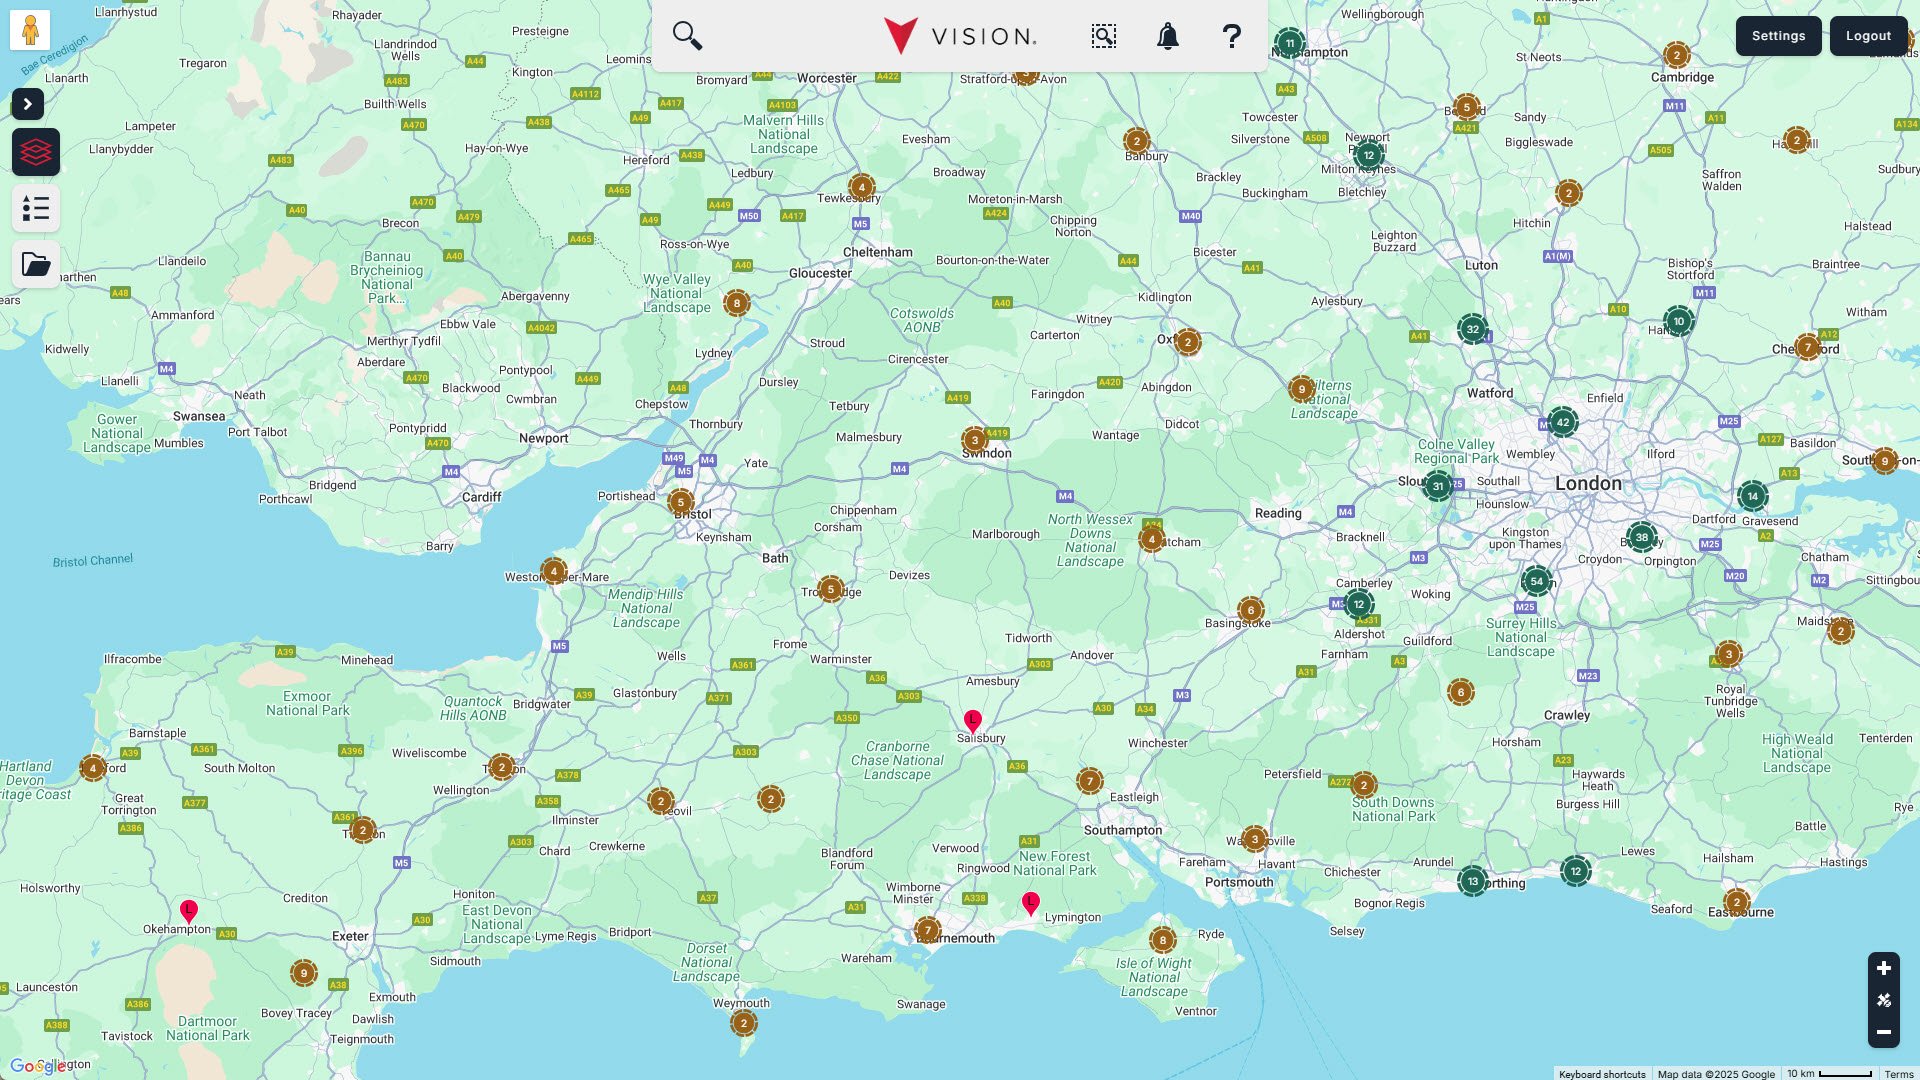
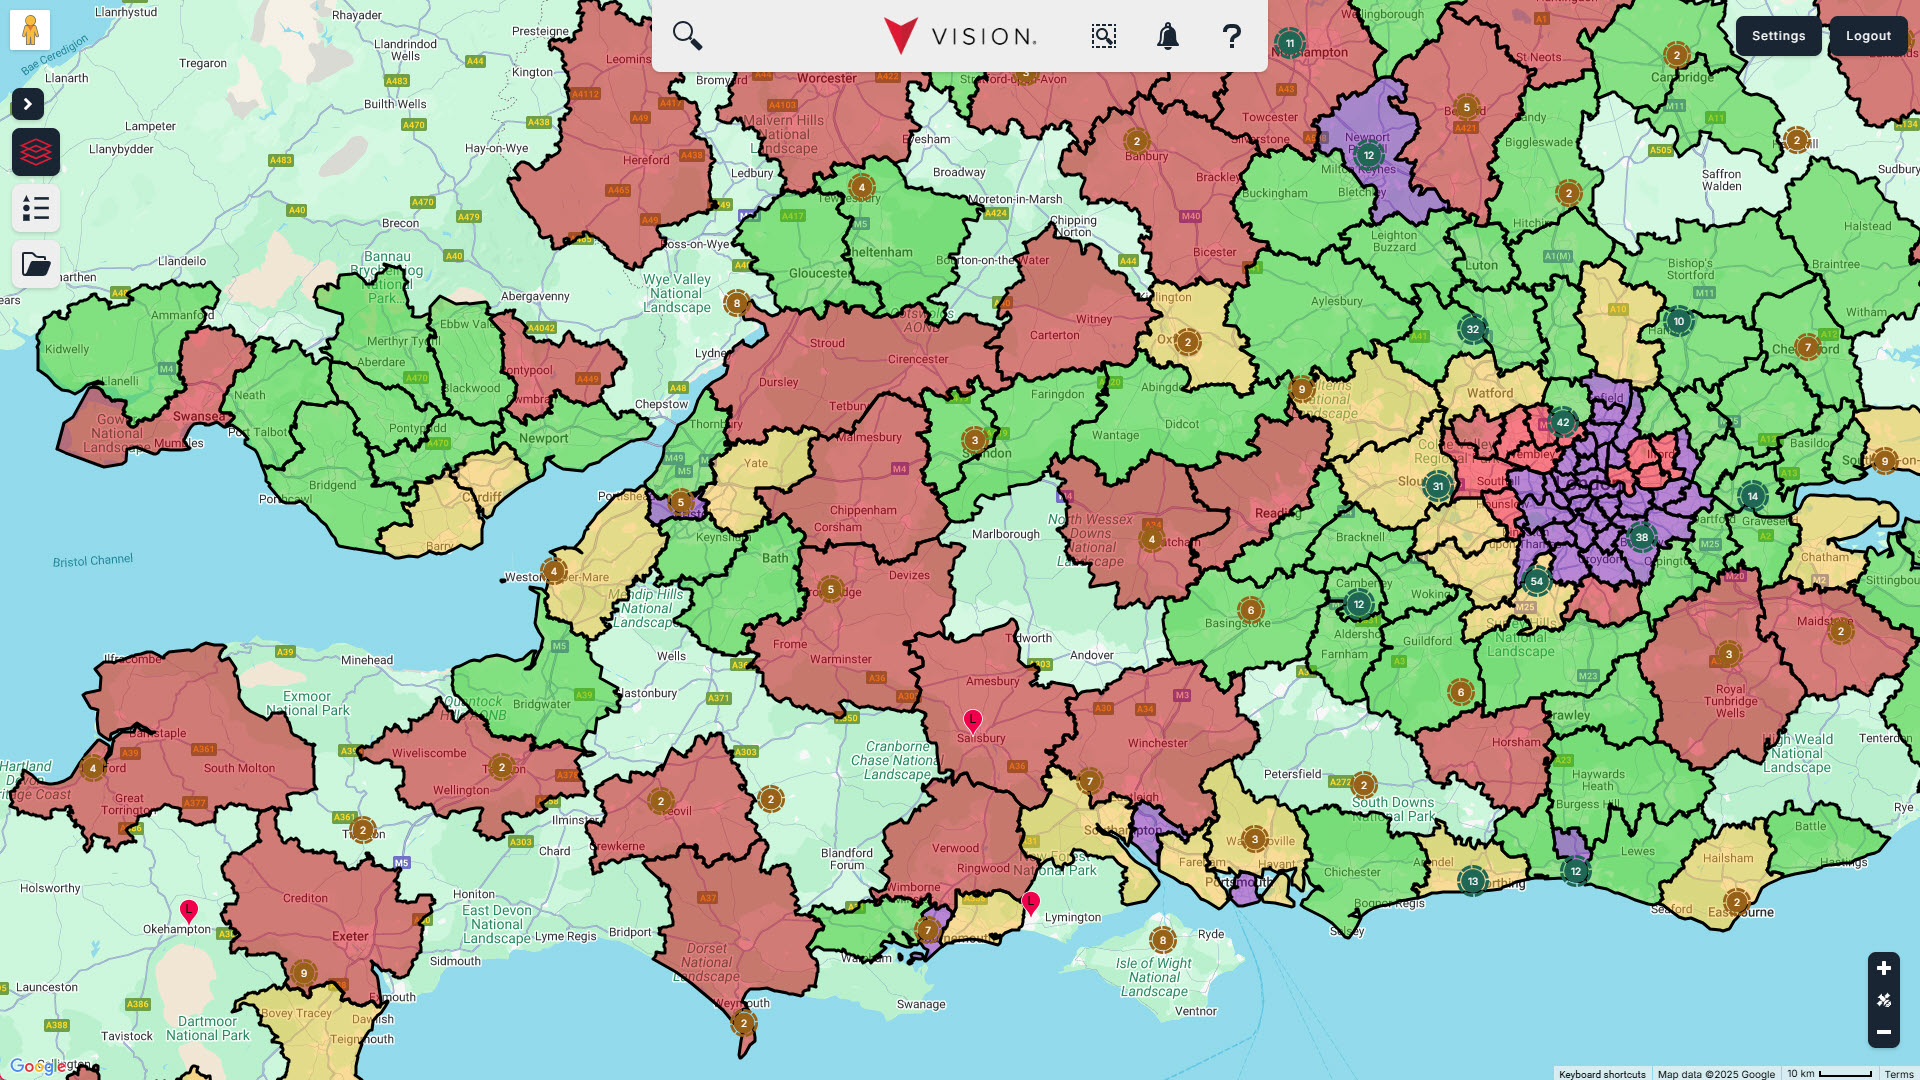
Before and After Using Atlas Mapping
See how data-led territory thinking reshapes a network.

Why school catchments are rarely clean
People like the idea of a simple catchment. A circle around the gates, job done. But real life does not do circles.
Some pupils travel further because of school type, faith, subjects, or special provision. Some areas look close but take ages because the roads are awkward. Some schools compete even when they’re not that near.
Then there’s the admin side. Wards and local authority boundaries are useful, but they don’t always match how families choose. Plus boundaries get updated over time, so if you’re using old shapes you can quietly drift off course.

What people actually want to know
School mapping is used by different teams for different reasons, but the questions sound similar:
- where do pupils come from right now, by postcode
- how far people are travelling in practice
- which areas are underserved, and which are saturated
- what demand looks like around a current site, or a possible new one
- where a service could grow, like tutoring, clubs, transport, suppliers
- how many schools sit inside a target patch, and what type they are
You can answer some of this with spreadsheets, sure. But it’s slow, and it hides the shape of the problem.

The data layer that makes school mapping easier
A big part of school mapping is just knowing what is out there. Not vaguely, but properly.
Vision has a UK School data add-on from Buzz Education, with around 30,000 school locations. It includes classifications from primary through to higher education, plus school names and contact info. It also supports counts of schools at different geographic levels, which helps when you’re planning coverage or prospecting.
And because school decisions are tied to families, demographics matter too. Vision data packs include population demographics, and other market info you can layer in when you need it.
Scale quicker
Increase ROI
Joined up team
Reduced risk
Clear vision
Confident decision making
How Atlas Mapping helps you see school mapping
Atlas Mapping’s online tool, Vision, is built for turning location data into something you can actually use. You can plot pins for sites, pupils, enquiries, or customers, then look at patterns instead of rows.
Vision also lets you build zones based on drive time or drive distance, so you can get a more realistic view of reach than a simple radius. It takes seconds to generate a drive zone around an address, then you can overlay it with your own data to see what sits inside and what sits outside.
If you’re planning across multiple areas, you can create and edit territories using preset geographies like postcodes, and you can share those areas with others. So the conversation stays in one place, not in five different versions of a map file.


Ready to realise your full potential?
Give us a ring, drop us an email, or fill in the form below to contact us.